The “fish-eye” lens has always fascinated me. It was my gateway into photography—its quirky, distorted charm never failed to add whimsy to my shots. Some of my favourite memories are capturing our furry friends🐶🐽🐄.
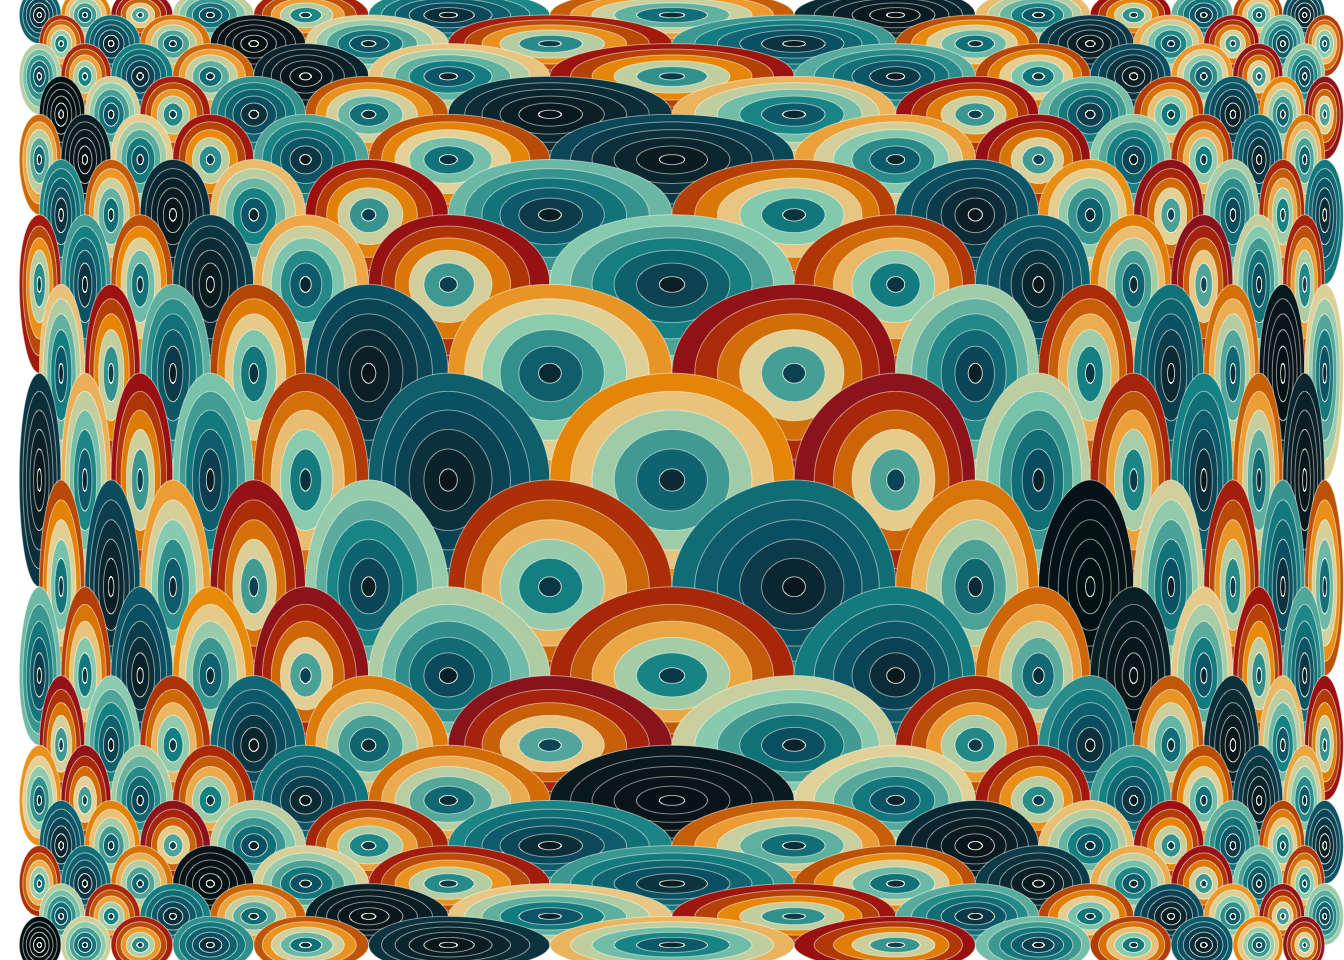
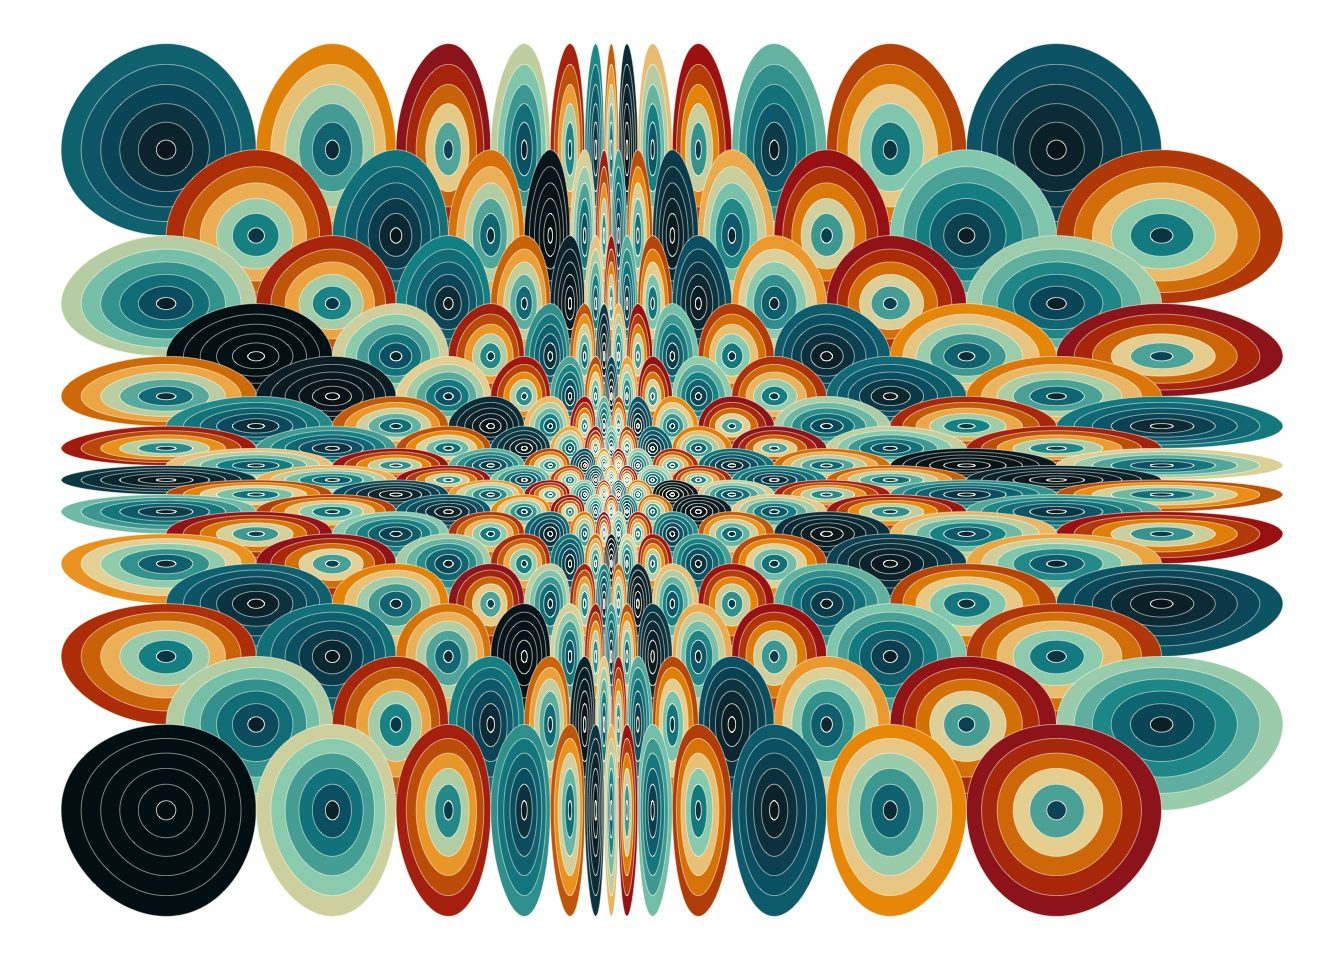
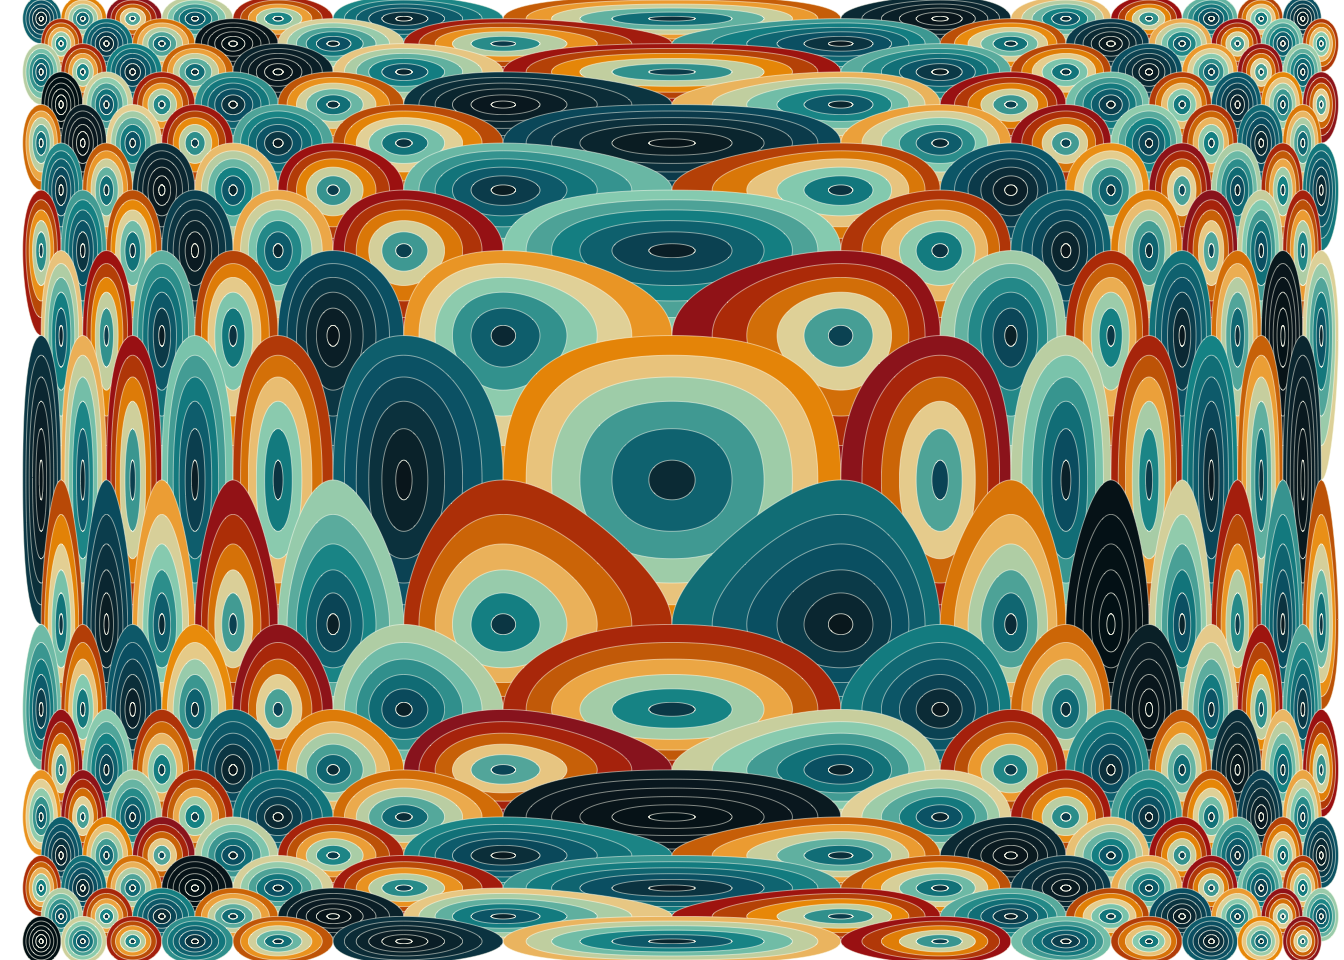
Recently, I started wondering why not bring that same fish-eye🐟👁️ magic into my data visualizations. While it may not suit business dashboards, it’s perfect for artistic visualizations. With ggplot2’s coord_trans() and its "pseudo_log" transformation as inspiration, I decied to push the boundaries and create my first custom transformation.
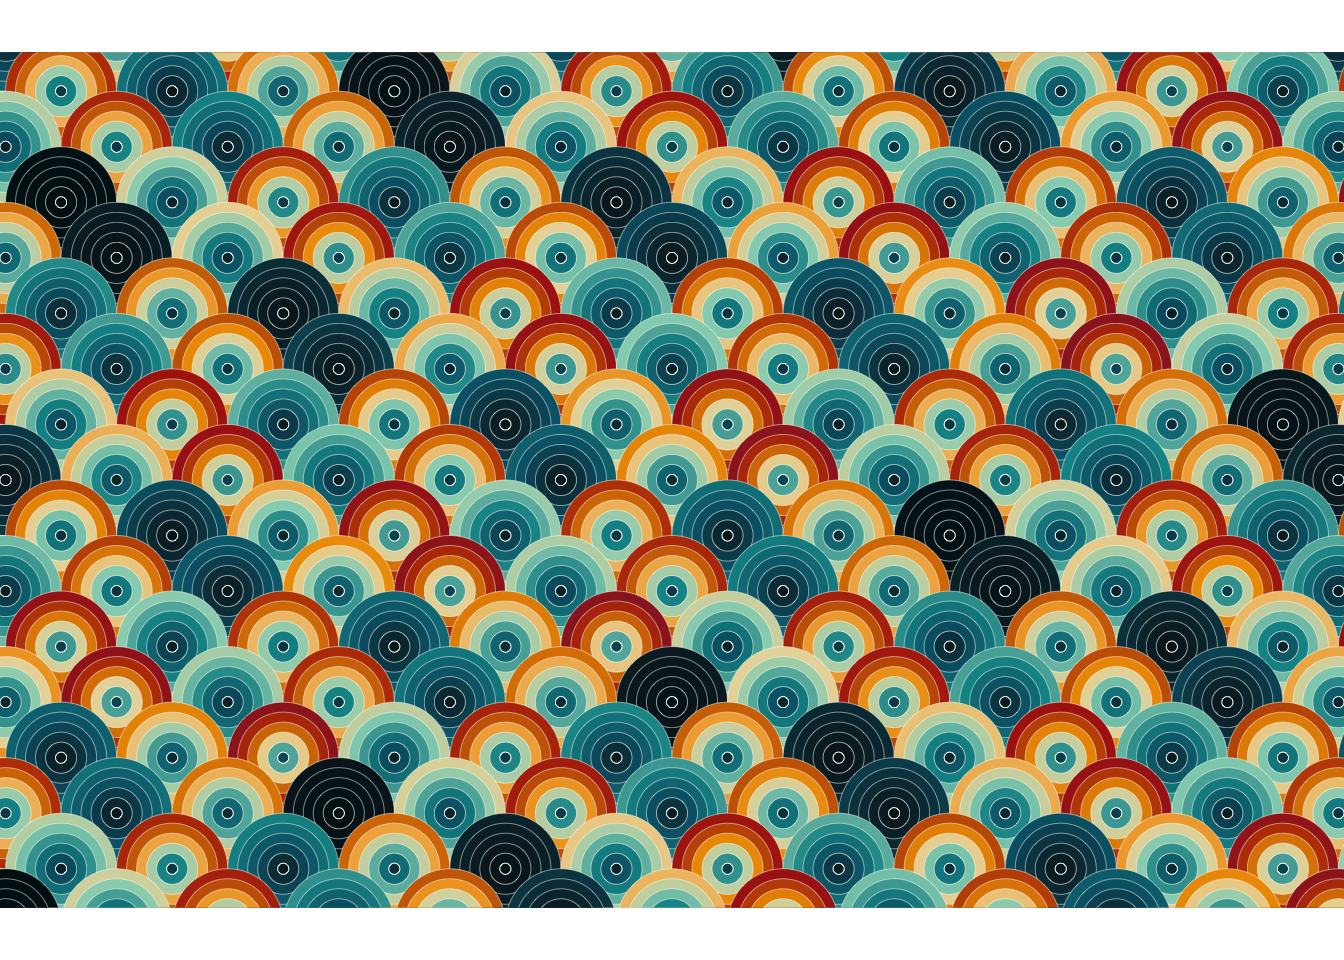
Digression : The Seigaha Motif as a Canvas 🎨
To test this idea, I used a Seigaha motif I created the other day. It’s a geometric design with overlapping circles that naturally lends itself to experimentation. I introduced randomness to the colors using irrational numbers as denominators, leveraging R’s modulo operation for real numbers. Just another attempt at creating “pseudo-randomness” in the design.
\[
x \mod y = x - \text{floor}\left(\frac{x}{y}\right) \times y
\]
Famous “Irrational” Numbers in Math
Golden Ratio
The Golden Ratio is often represented by the Greek letter \(\phi\) and is defined as: \[
\phi = \frac{1 + \sqrt{5}}{2}
\]
Silver Ratio
The lesser-known Silver Ratio, represented by \(\delta_s\), is defined as: \[
\delta_s = 1 + \sqrt{2}
\]
Euler’s Number
Euler’s number, represented by \(e\), is a fundamental constant in mathematics: \[
e = \exp(1)
\] It is approximately \(e \approx 2.718\).
Code
library(tidyverse) # Easily Install and Load the 'Tidyverse' library(ggforce) # Accelerating 'ggplot2' library(cowplot) # Streamlined Plot Theme and Plot Annotations for 'ggplot2' library(gt) # Easily Create Presentation-Ready Display Tables ### just declaring the colour palette herecol10 <-str_split("001219-005f73-0a9396-94d2bd-e9d8a6-ee9b00-ca6702-bb3e03-ae2012-9b2226","-")col10_pal <-str_c("#",col10 |>unlist())### Creating data frame that is basis of layoutdf <-expand_grid(x =seq(-12, 12, by =2), y =seq(-8, 8, by =1)) |>arrange(y,x) |>mutate(y_odd=(y%%2==1)) |>mutate(idx=row_number()-1) |>mutate(x=if_else(y_odd,x+1,x))### For each grid location, I want 6 concentric circlesr_values <-seq(0.1,1,length.out=6)### Just defining some "Irregular Numbers" that I can use with Modulo gr <- (1+sqrt(5)) /2## the golden ratio sr <- (1+sqrt(2)) ##. lesser known silver ratioeuler_num <-exp(1)df_long <- df |>expand_grid(r=r_values) |>mutate(r_var=r*(idx%%sr)+1) ## I'm experimenting here with modulo with pi
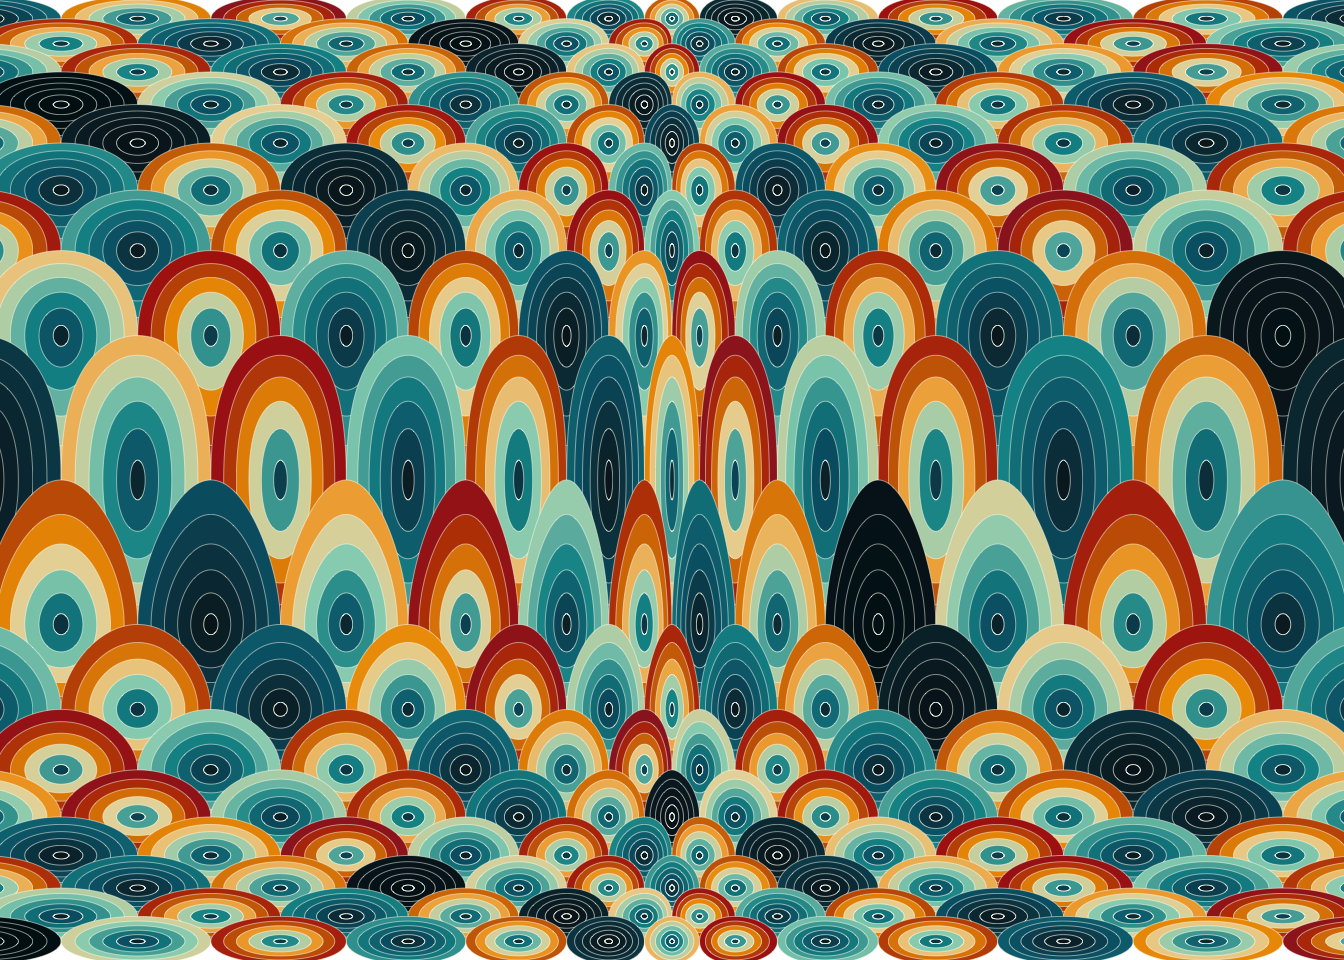
Cartesian Coordinates: The Baseline
Here’s the unaltered design using coord_fixed, maintaining regular Cartesian coordinates.