👋 Welcome to the Chi-Files!
Every great journey begins with a single step—or in this case, a single post. Really I’m just trying to learn how to use Quarto…
🌟 Why the “Chi-Files”?
The blog name is a nod to my love of mystery, discovery, and exploration. Data can be like an unsolved case—full of patterns, stories, and hidden gems waiting to be uncovered.

The Chi-Square Test: Solving Data Mysteries 🛸
In the Chi-Files, every dataset is a puzzle, and the chi-square statistic is our investigative tool to uncover hidden relationships.
The formula for the chi-square statistic is:
\[ \chi^2 = \sum \frac{(O_i - E_i)^2}{E_i} \]
Where: - \(O_i\) = Observed frequency - \(E_i\) = Expected frequency - \(\sum\) = The summation symbol, meaning we sum across all categories.
An X-Files Twist
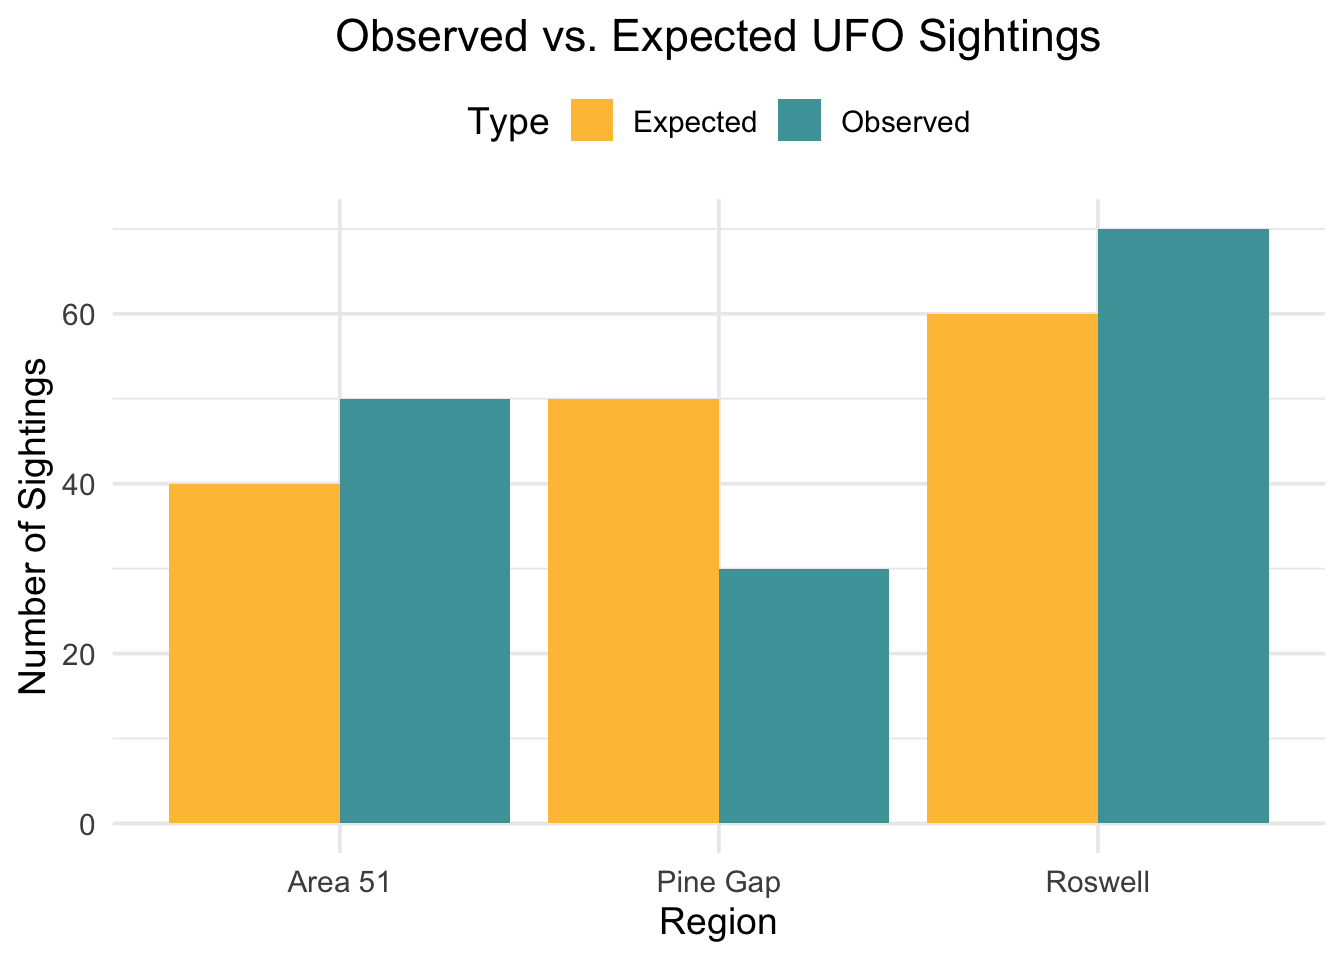
Suppose we’re investigating sightings of UFOs 👽 across regions:
| Region | Observed Sightings (\(O_i\)) | Expected Sightings (\(E_i\)) |
|---|---|---|
| Area 51 | 50 | 40 |
| Roswell | 70 | 60 |
| Pine Gap | 30 | 50 |
Using the chi-square formula, we calculate:
\[ \chi^2 = \frac{(50 - 40)^2}{40} + \frac{(70 - 60)^2}{60} + \frac{(30 - 50)^2}{50} \]
This leads to:
\[ \chi^2 = \frac{100}{40} + \frac{100}{60} + \frac{400}{50} = 2.5 + 1.67 + 8 = 12.17 \]
If this value exceeds the critical value, we may conclude there’s something strange going on in these regions… but the truth is out there! 🛸
Important
The chi-square test reveals mysteries hidden in plain data. Use it wisely, and remember: the truth is out there! 🛸